Exosphere Dashboard
The Exosphere dashboard provides a comprehensive web interface for monitoring, debugging, and managing your workflows. This guide shows you how to set up and use the dashboard effectively.
📚 Getting Started: For a complete local setup guide covering both the state manager and dashboard, see our Local Setup Guide.
Dashboard Overview
The Exosphere dashboard is a modern web application that connects to your state manager backend through secure server-side routes and provides:
- Real-time monitoring of workflow execution
- Visual graph representation of your workflows
- State management and debugging tools
- Performance metrics and analytics
- Error tracking and resolution
- Graph template management and validation
Setup Guide
Prerequisites
Before setting up the dashboard, ensure you have:
- A running Exosphere state manager (see State Manager Setup)
- Your API key and namespace from the state manager
- Docker (for containerized deployment)
- Environment configuration file (.env.local for local development)
The easiest way to run the dashboard is using the pre-built Docker container. This approach ensures consistent environments and minimal setup.
Prerequisites
- Docker installed
Setup Steps
-
Pull the latest dashboard image and run:
# Pull the latest dashboard image docker pull ghcr.io/exospherehost/exosphere-dashboard:latest # Run the dashboard container with secure environment variables docker run -d \ --name exosphere-dashboard \ -p 3000:3000 \ -e EXOSPHERE_STATE_MANAGER_URI="http://localhost:8000" \ -e EXOSPHERE_API_KEY="your-secure-api-key" \ -e NEXT_PUBLIC_DEFAULT_NAMESPACE="your-namespace" \ ghcr.io/exospherehost/exosphere-dashboard:latest -
Verify the service is running:
The dashboard will be available at http://localhost:3000
Required Environment Variables
| Variable | Description | Required | Default |
|---|---|---|---|
EXOSPHERE_STATE_MANAGER_URI |
State manager API endpoint | Yes | - |
EXOSPHERE_API_KEY |
REQUIRED: Secure API key for state manager access | Yes | exosphere@123 |
NEXT_PUBLIC_DEFAULT_NAMESPACE |
Default namespace for workflows | No | default |
💡 Default API Key:
EXOSPHERE_API_KEYdefaults toexosphere@123(same as state manager's default secret)🔐 Authentication: When the dashboard sends API requests to the state-manager, the
EXOSPHERE_API_KEYvalue is checked for equality with theSTATE_MANAGER_SECRETvalue in the state-manager container.
For development or customization, you can run the dashboard locally using the source code.
Prerequisites
- Node.js 18 or higher
- npm or yarn package manager
- Git
Setup Steps
-
Clone the repository:
-
Install dependencies:
-
Set up environment variables:
-
Start the development server:
The dashboard will be available at http://localhost:3000
Environment Variables
Create a .env.local file in the dashboard directory with these variables:
# Server-side secure configuration (NOT exposed to browser)
EXOSPHERE_STATE_MANAGER_URI=http://localhost:8000
EXOSPHERE_API_KEY=exosphere@123

# Client-side configuration (exposed to browser)
NEXT_PUBLIC_DEFAULT_NAMESPACE=your-namespace
💡 Default API Key:
EXOSPHERE_API_KEYdefaults toexosphere@123(same as state manager's default secret)🔐 Authentication: When the dashboard sends API requests to the state-manager, the
EXOSPHERE_API_KEYvalue is checked for equality with theSTATE_MANAGER_SECRETvalue in the state-manager container.
🔒 Security Architecture
Server-Side Rendering (SSR) Implementation
The Exosphere Dashboard has been refactored to use Next.js API routes for enhanced security:
- API Key Protection: All sensitive credentials are stored server-side
- Secure Communication: Client never directly communicates with state-manager
- Environment Isolation: Sensitive config separated from public code
- Production Ready: Enterprise-grade security for production deployments
API Route Structure
/api/runs              → Secure runs fetching with pagination
/api/graph-structure   → Protected graph visualization data
/api/namespace-overview → Secure namespace summary
/api/graph-template    → Protected template management
Security Benefits
- No API Key Exposure: Credentials never visible in browser
- Server-Side Validation: All requests validated before reaching state-manager
- Environment Security: Sensitive variables isolated from client bundle
- Audit Trail: All API calls logged server-side for monitoring
Dashboard Interface
The Exosphere dashboard features a clean, modern interface with three main sections accessible via the navigation tabs at the top.
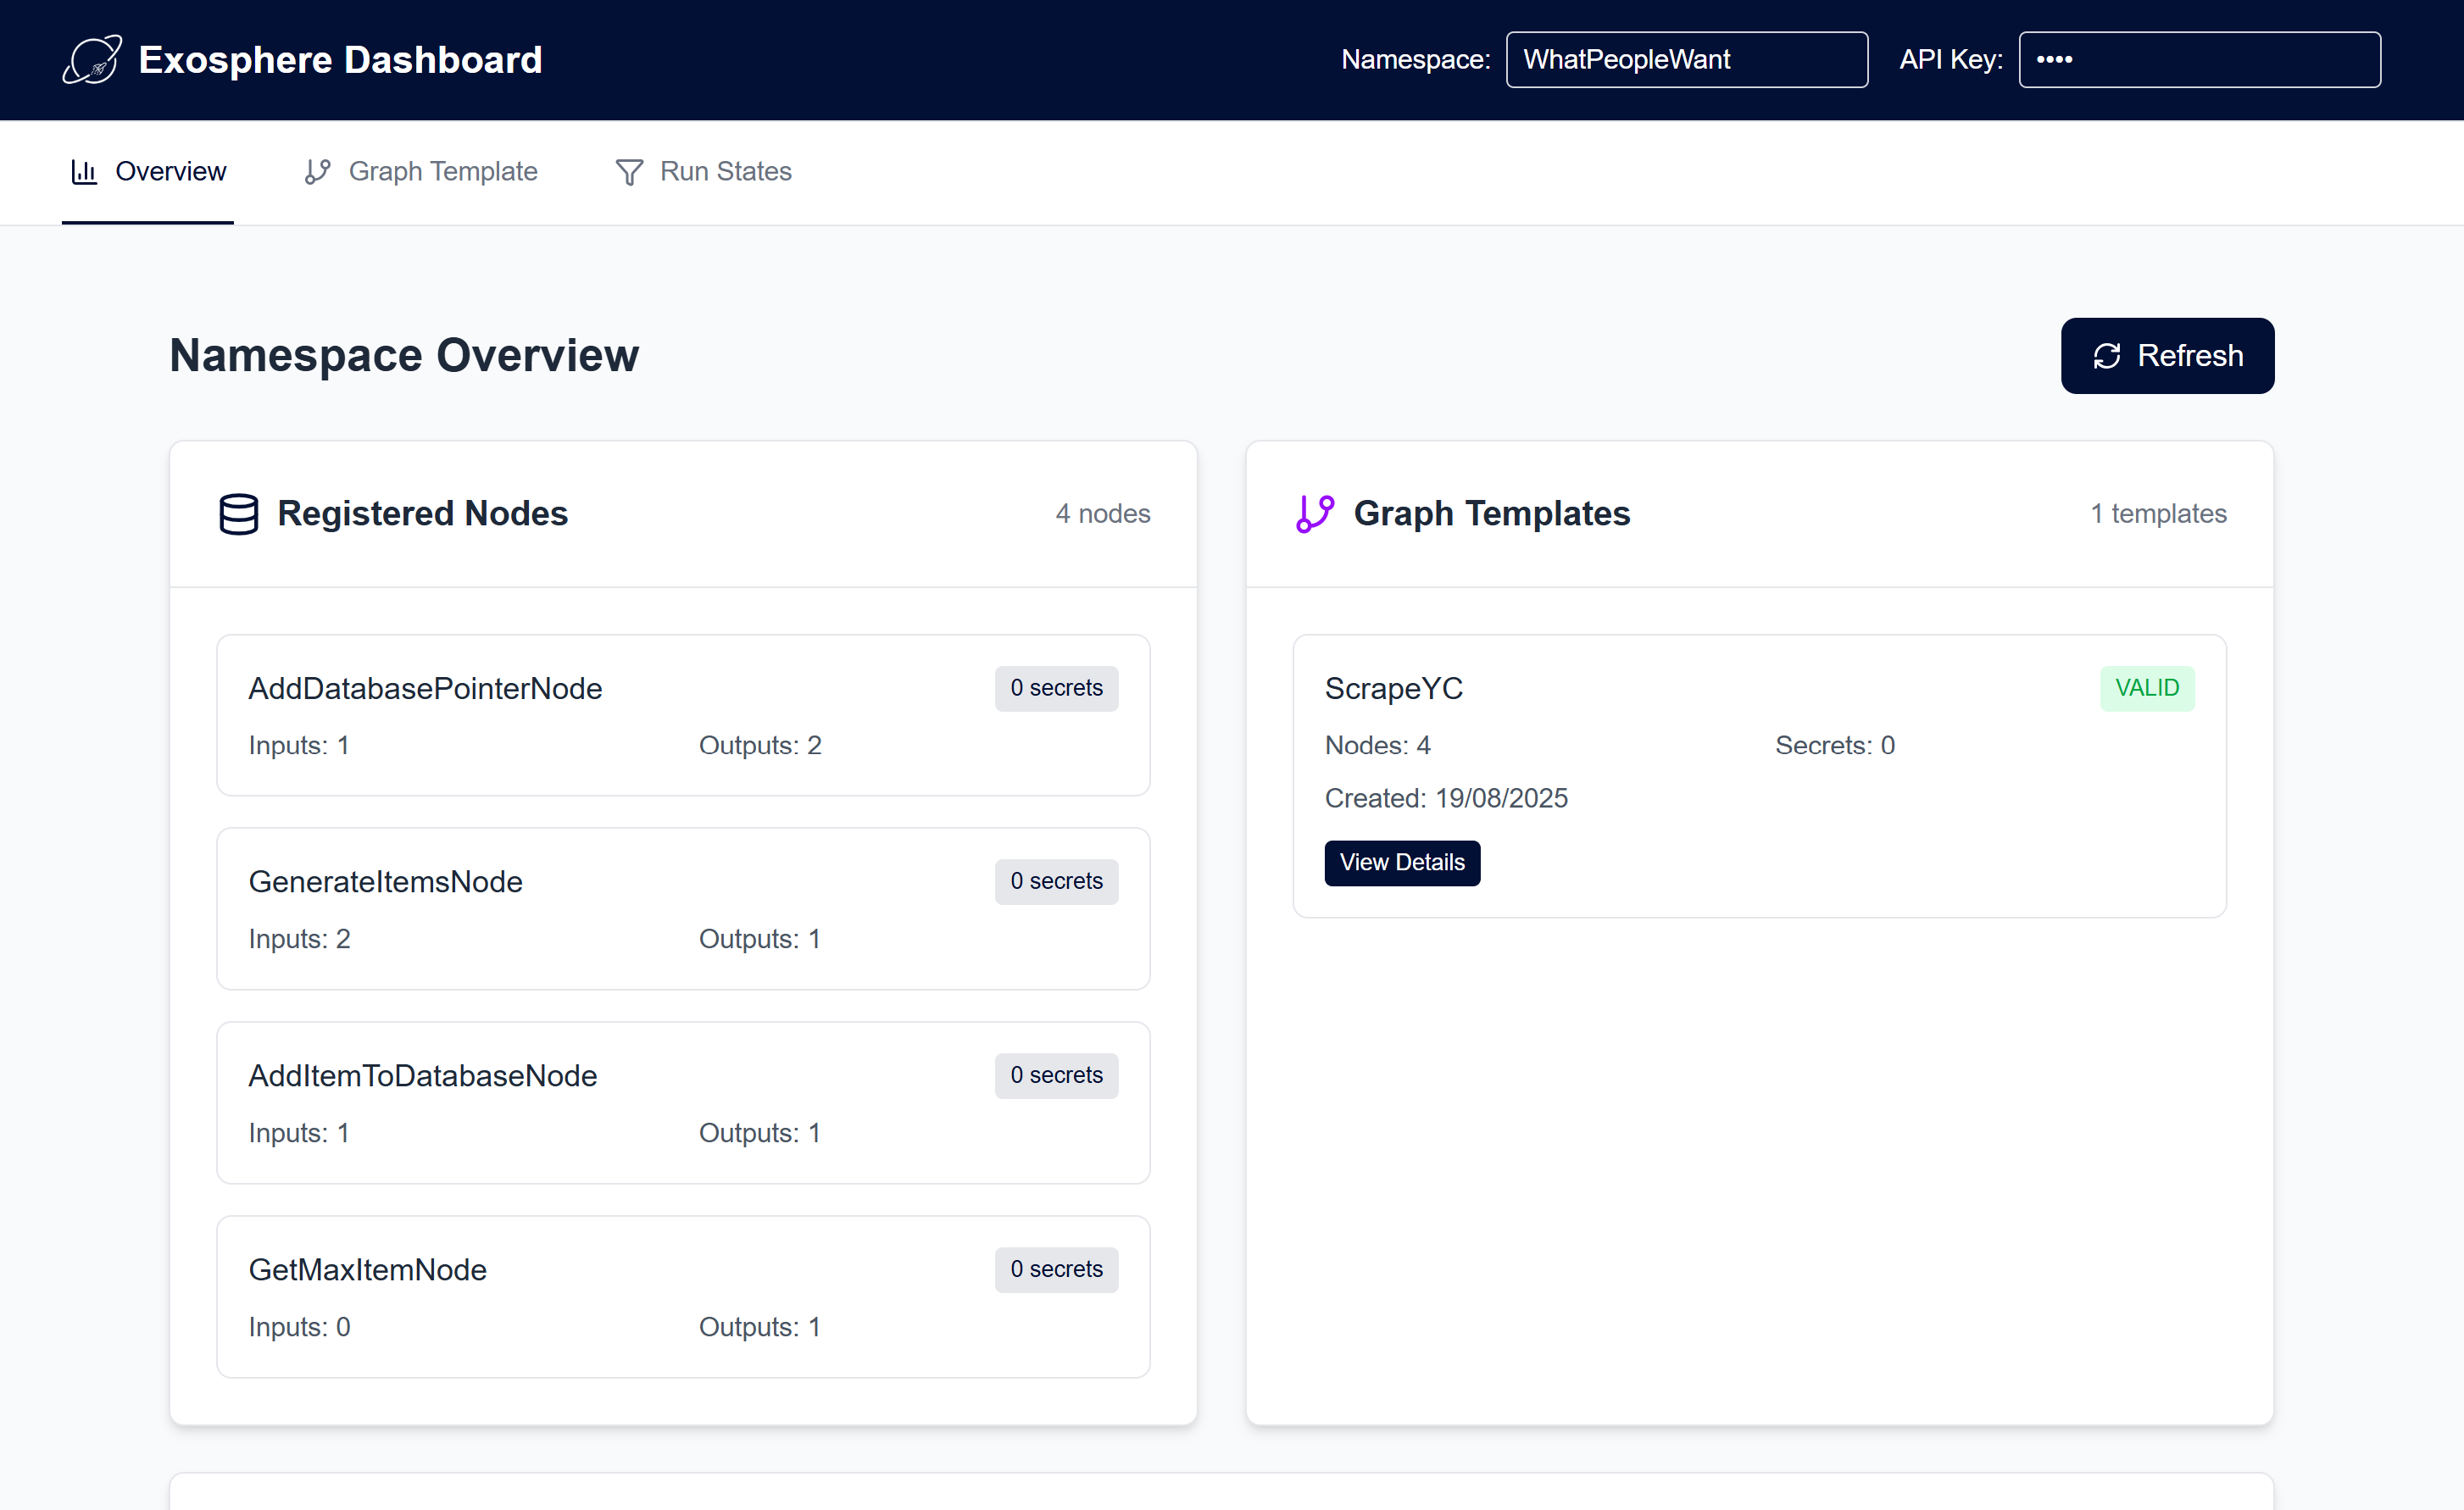
View registered nodes, and graph templates on a namespace
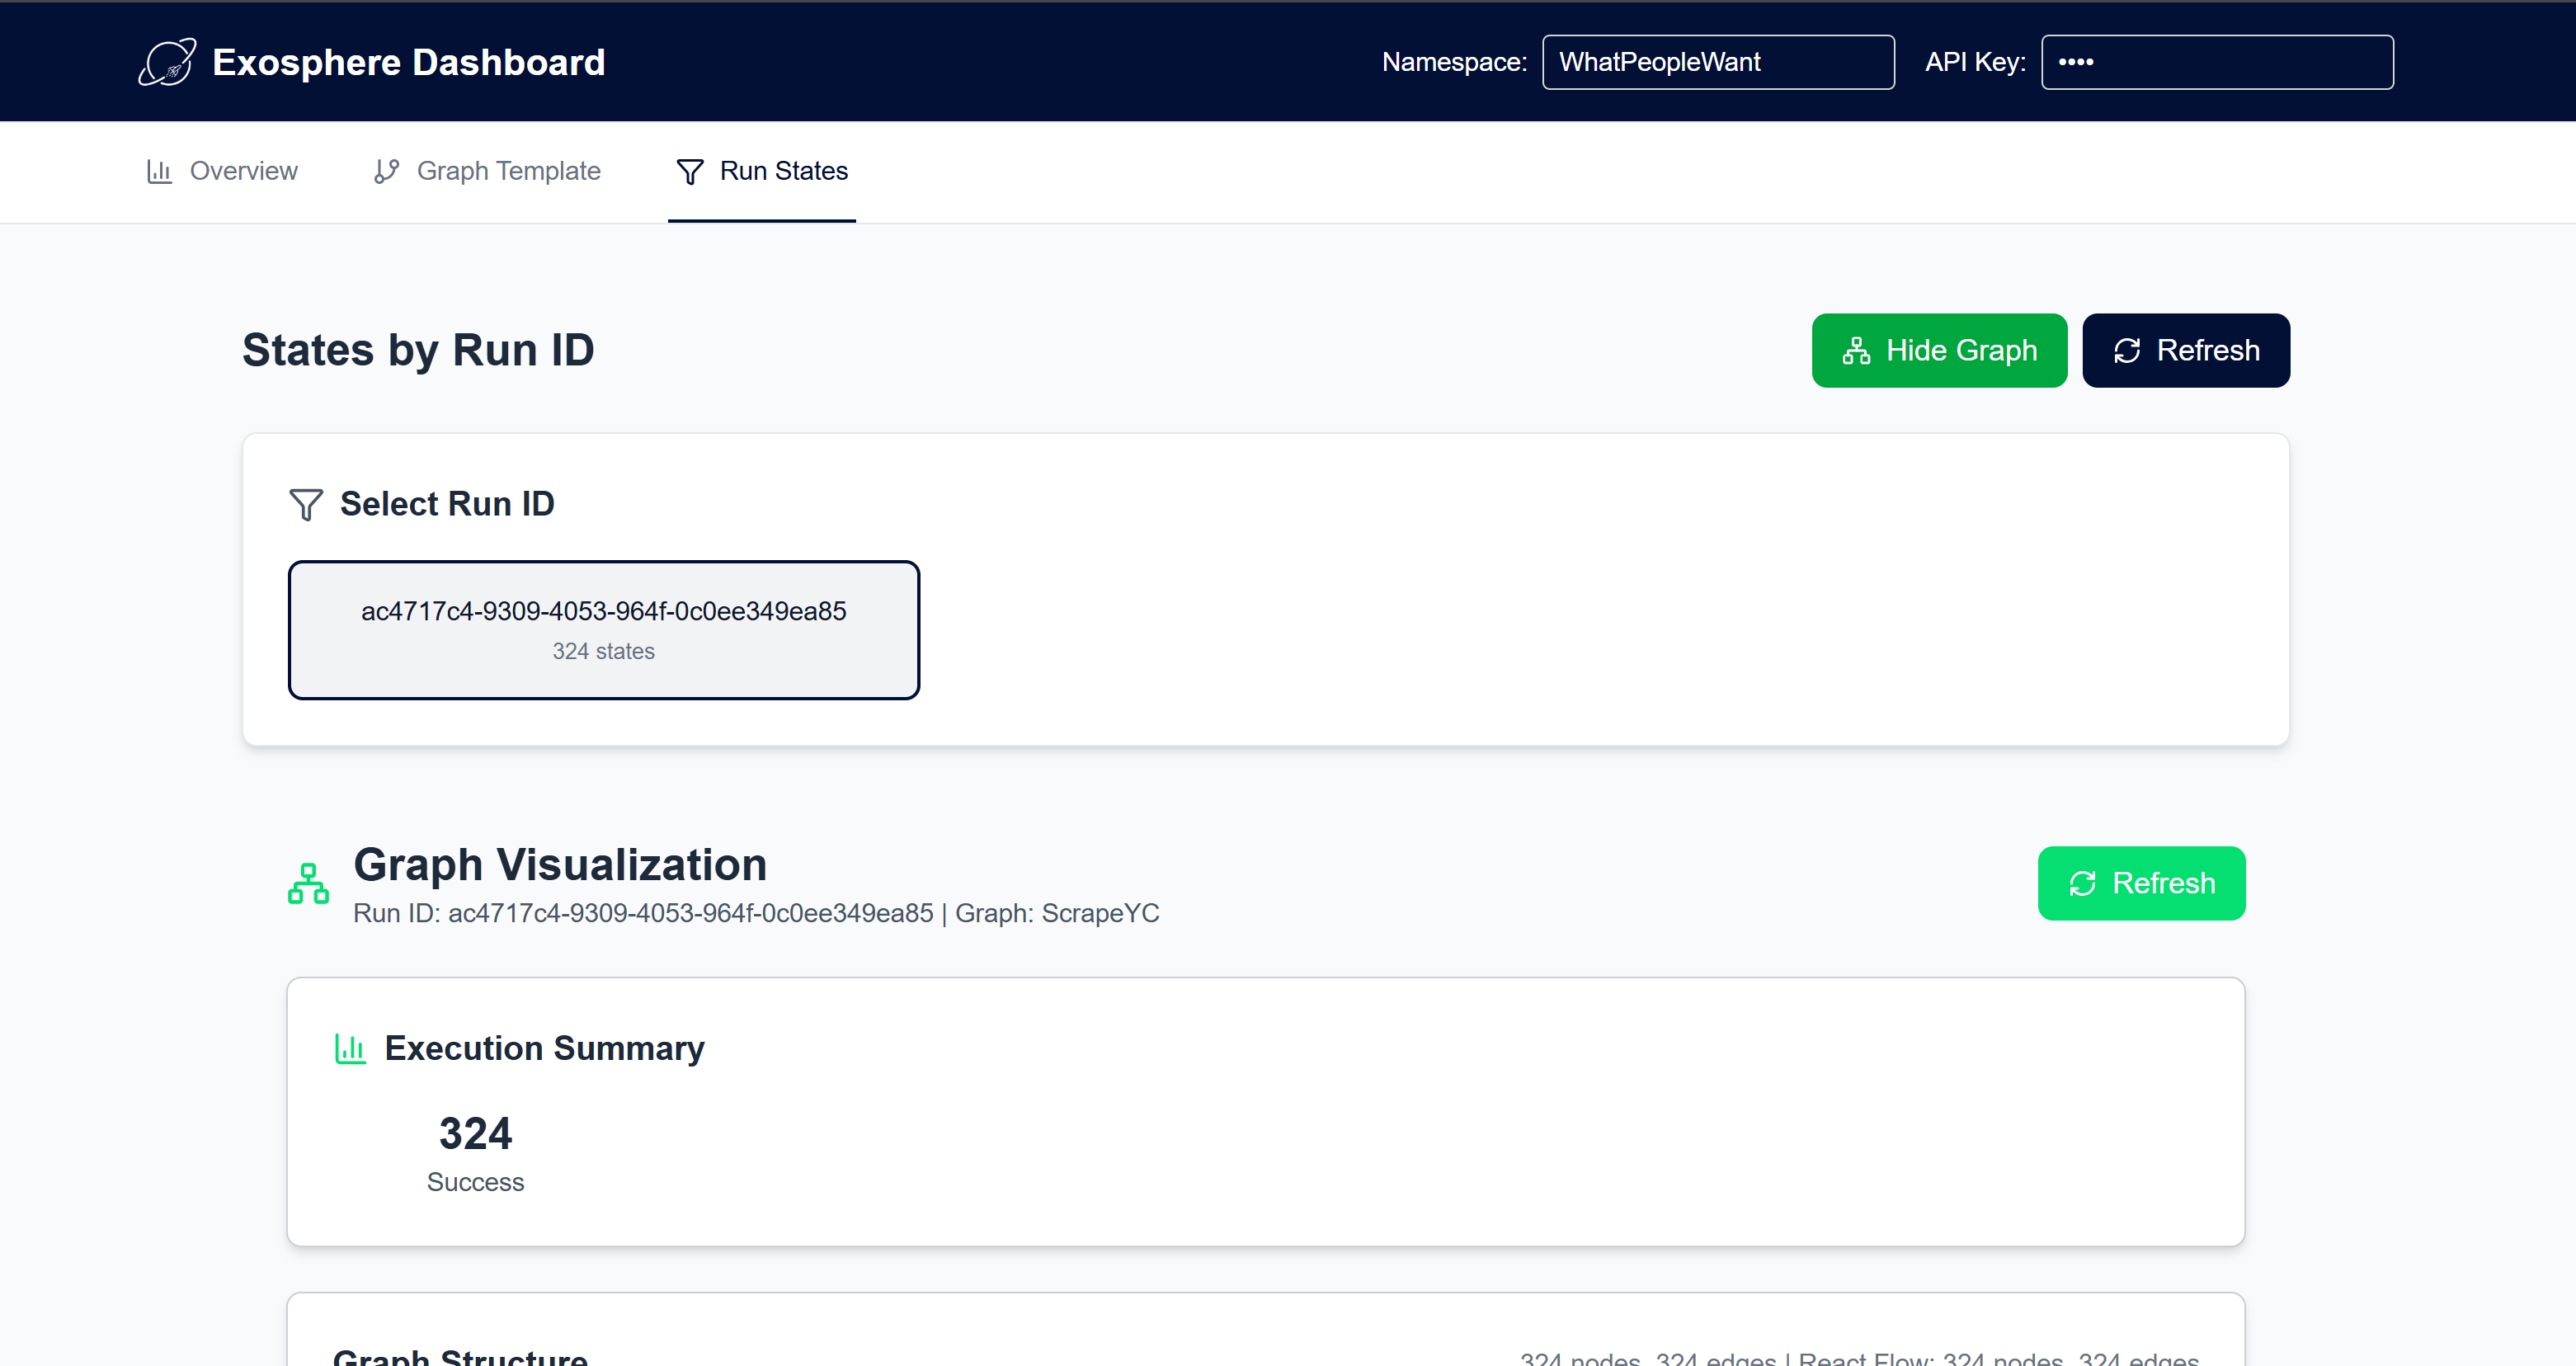
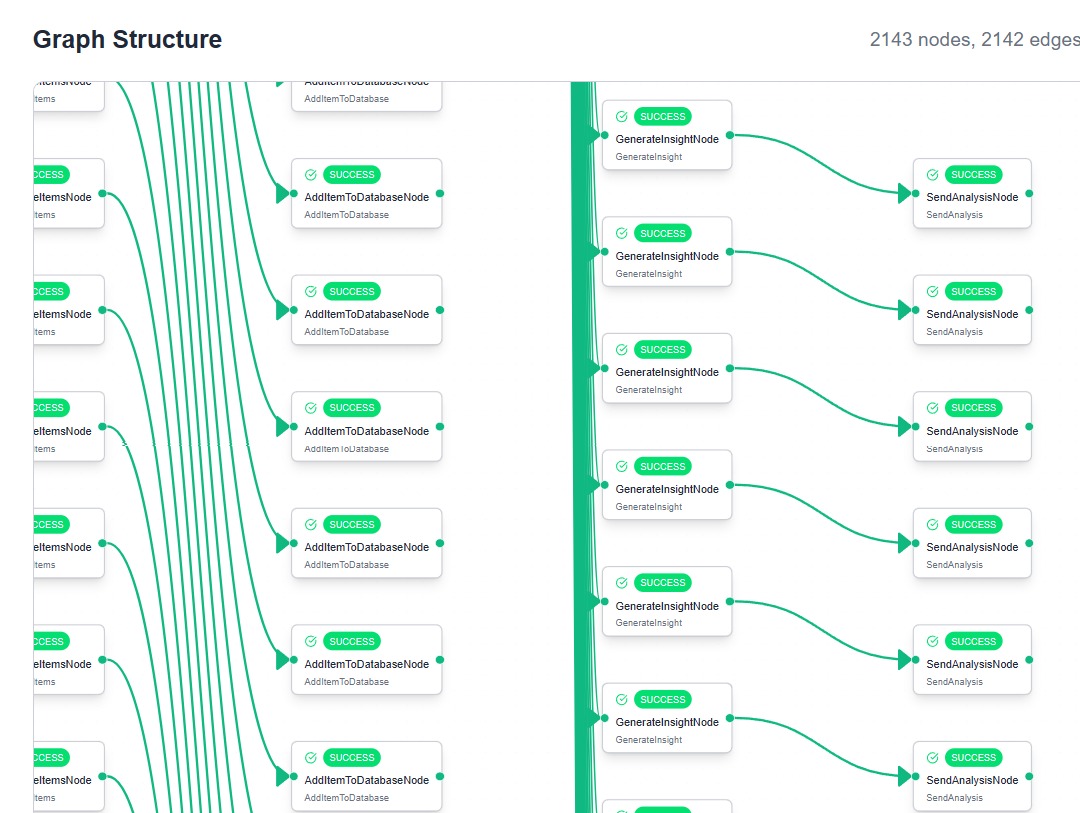 View graph runs and debug each node that was created.
Using the Dashboard
-
Configure Connection:
- Set your namespace in the header (or use environment variable)
- API key is automatically handled server-side
- Ensure your state manager is running
-
Explore Overview:
- Review registered nodes and their capabilities
- Check graph template status and validation
- Monitor namespace statistics
-
Manage Templates:
- View existing graph templates
- Create new templates using the builder
- Validate template configurations
-
Monitor Execution:
- Select specific run IDs to track
- View real-time execution progress
- Debug failed states and errors
Support
For additional help: - Check the State Manager Setup guide - Review Architecture for workflow understanding
Next Steps
- Architecture - Learn about Exosphere's architecture
- State Manager Setup - Complete backend setup guide
Related Concepts
- Fanout - Create parallel execution paths dynamically
- Unite - Synchronize parallel execution paths
- Retry Policy - Build resilient workflows
- Store - Persist data across workflow execution